The real suspension system total cost isn’t what you think it is.
Let’s be honest—when you see LiquidSpring’s price tag, your first thought is probably “That’s expensive.” We get it. But here’s what that sticker price doesn’t tell you: the City and County of Honolulu discovered that LiquidSpring® actually saves them 33% on maintenance costs compared to traditional suspension systems.
That’s right—what looks like a premium purchase actually pays for itself through reduced maintenance, better fuel efficiency, and longer component life. We’re talking about real money saved, not theoretical benefits.
This analysis breaks down the actual numbers over five years, showing you exactly why smart fleet managers, RV owners, and adventure truck enthusiasts choose LiquidSpring® despite the higher upfront cost. The suspension system total cost story is much more than the initial investment. Consider what you’ll actually spend (and save) over the life of your vehicle.
What You’ll Discover in This Analysis
- How Honolulu’s 164-vehicle fleet saves thousands annually with LiquidSpring®
- The real performance and cost differences between LiquidSpring® and air suspension
- Why traditional leaf springs cost more over time than premium liquid technology
- Five-year financial projections based on real-world data
- Why LiquidSpring® beats every traditional suspension option
Bottom line upfront: LiquidSpring® reaches break-even at approximately 5.8 years for typical applications, then delivers $2,000-$3,000 in annual savings for years 7-10 and beyond. The suspension system total cost analysis shows that premium technology becomes the smart financial choice when you think long-term.
Honolulu Fleet Case Study: Real Numbers, Real Savings
Want to see what LiquidSpring® actually costs in the real world? Look no further than Hawaii’s toughest testing ground.
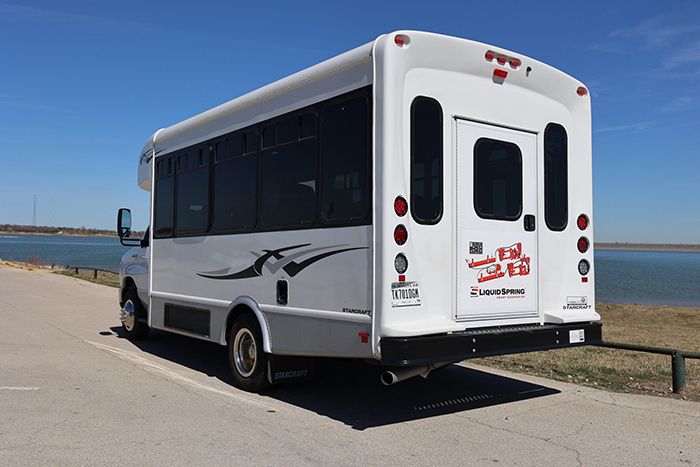
The City and County of Honolulu operates paratransit services in some of the most challenging road conditions in America. We’re talking constant construction, patched roads, and the kind of conditions that destroy traditional suspension systems. After equipping 164 vehicles with LiquidSpring® technology, they discovered something remarkable: their suspension system total cost actually went down.
Not everybody is driving a fleet full of buses, of course, but there’s a lot to be learned from checking out the fleet’s maintenance records and applying that to your own usage.
The Numbers That Matter
Bobby Wallace, Honolulu’s Fleet Manager, didn’t mince words about the results:
Maintenance Cost Reduction:
- 33% lower costs per mile: LiquidSpring® vehicles cost $0.83 per mile versus $1.24 for traditional suspension
- Complete elimination of the leaf spring bracket failures that plagued their traditional fleet
- Front tire replacement rates nearly 2:1 better on LiquidSpring®-equipped vehicles
Fuel Efficiency Gains:
- $10,000 monthly savings on a 27-vehicle LiquidSpring® fleet
- $120,000 projected annual fuel savings for this fleet segment alone
- Drivers can maintain cruising speeds more consistently, reducing fuel-wasting brake-and-accelerate cycles
Safety Improvements:
- Zero passenger injuries related to vehicle movement since installation
- No more passengers hitting their heads on ceiling fixtures
- Complete elimination of shoulder and neck injuries from vehicle jolts
“Just great experience with LiquidSpring all the way around,” Wallace confirms. “In the past, we used to have a lot of injuries. People would actually hit their head on the AC unit because of the jolt that rear suspension gives. With LiquidSpring, that doesn’t happen at all.”
What This Means for Your Suspension System Total Cost
For Honolulu’s 164-vehicle fleet, the math is clear:
- $67,000 annual maintenance savings based on typical fleet mileage
- $120,000 annual fuel savings on tested segments
- $15,000 annual tire replacement savings across the fleet
- Over $200,000 total annual savings for a single municipal fleet
That’s not theoretical—that’s money staying in their budget instead of going to repairs, fuel, and tire replacements. The suspension system total cost analysis shows that what seemed like an expensive upgrade actually became their best investment.
LiquidSpring® vs. Air Suspension: Performance and Cost Analysis
Air suspension systems represent a common upgrade path for fleet operators and RV owners seeking improved ride quality. However, the comparison reveals significant differences in both performance and long-term costs.
Technology Comparison
Air Suspension Limitations:
- Passive system: Relies on preset air pressure with limited adaptability
- Temperature sensitivity: Performance varies with altitude and weather conditions
- Maintenance complexity: Air lines, compressors, and electronic controls require regular service
- “Floaty” ride quality: Often provides comfort at the expense of precise handling
LiquidSpring® Advantages:
- Active system: Onboard microprocessor adjusts 1,000 times per second to road conditions
- Consistent performance: Liquid-based technology unaffected by temperature or altitude
- Reduced maintenance: Fewer failure points and more robust component design
- Precise handling: Provides both comfort and control without compromise
Cost Analysis: Air Suspension vs. LiquidSpring®
Initial Investment:
- Air suspension systems: $8,000-$15,000 installed
- LiquidSpring® systems: $15,000-$28,000 installed
- Investment difference: $7,000-$13,000 higher for LiquidSpring®
Annual Operating Costs:
- Air suspension maintenance: $800-$1,200 annually (compressor service, air line replacement)
- LiquidSpring® maintenance: $300-$500 annually (minimal service requirements)
- Annual savings: $500-$700 with LiquidSpring®
Five-Year Cost Comparison:
- Air suspension total cost: $22,000-$21,000
- LiquidSpring® total cost: $16,500-$28,500
- LiquidSpring® advantage: $3,500-$5,500 over five years, before considering performance benefits
LiquidSpring® vs. Leaf Spring Systems: Handling the Fundamentals
Traditional leaf spring suspension represents the baseline for most commercial and heavy-duty applications. While cost-effective initially, leaf springs can create significant long-term expenses through maintenance and operational inefficiencies.
Performance Comparison
Leaf Spring Characteristics:
- Fixed spring rate: Cannot adapt to varying loads or road conditions
- Harsh ride quality: Transmits road shock directly to the vehicle and occupants
- Maintenance intensive: Regular bushing replacement, bracket repairs, and leaf spring resets
- Tricky handling: Minimal roll control and stability in cornering
LiquidSpring® Performance:
- Variable spring rate: Automatically adjusts from soft to firm based on conditions
- Superior ride quality: Liquid-based dampening absorbs road impacts effectively
- Minimal maintenance: Sealed system with proven longevity
- Enhanced handling: Five-link design provides precise control and stability
Maintenance Cost Analysis
Based on the Honolulu case study data and industry benchmarks:
Leaf Spring Annual Maintenance (per vehicle):
- Routine inspections: $50-$100
- Occasional bushing replacement (amortized): $50-$100
- Minor repairs and adjustments: $50-$100
- Total realistic annual maintenance: $150-$300
LiquidSpring® Annual Maintenance (per vehicle):
- Routine inspections: No cost, owners can do this themselves
- Minimal component replacement: Less than $100 annually
- Total annual maintenance: Less than $100 annually
Annual savings per vehicle: $750-$1,300 with LiquidSpring®
Five-Year Total Cost of Ownership Analysis
Initial Investment: Understanding the Premium
LiquidSpring® systems require a higher upfront investment compared to traditional suspension alternatives. A typical LiquidSpring® installation costs approximately $28,000, while traditional suspension upgrades range from $5,000 to $12,000. This creates an initial investment premium of $16,000 to $23,000 that must be evaluated against long-term operational savings.
The premium reflects LiquidSpring’s advanced technology, including the onboard microprocessor that assesses 1,000 times per second, the proprietary liquid-based strut system, and the precision-engineered five-link suspension design. This sophisticated technology requires higher manufacturing costs but delivers measurable operational benefits that justify the investment over time.
Maintenance Cost Analysis: The 33% Advantage
The Honolulu paratransit fleet case study is proof that LiquidSpring® delivers real maintenance savings. With 164 vehicles equipped with LiquidSpring® technology, they consistently see 33% lower maintenance costs per mile compared to traditional suspension systems.
Here’s the breakdown: traditional suspension vehicles cost them $1.24 per mile to maintain, while LiquidSpring®-equipped vehicles cost just $0.83 per mile. That $0.41 per mile difference adds up fast—$410 in savings for every 1,000 miles driven. Drive 20,000 miles annually? You could be looking at $8,200 in maintenance savings every year.
Why such a big difference? LiquidSpring’s sealed liquid-based design eliminates the frequent component failures that plague traditional systems. Bobby Wallace, Fleet Manager for Honolulu Paratransit Services, puts it simply: they completely eliminated the leaf spring bracket failures that were routine maintenance headaches on traditional suspension vehicles.
Fuel Efficiency Improvements: Beyond the Initial Investment
Here’s something that surprises most people: LiquidSpring® actually improves fuel economy. The Honolulu fleet testing revealed significant fuel efficiency improvements—a 27-vehicle fleet equipped with LiquidSpring® saves $10,000 monthly on fuel compared to traditional suspension. That projects to $120,000 in annual fuel savings for just that segment.
The reason? LiquidSpring® maintains optimal vehicle stability, so drivers don’t have to constantly adjust their speed. The smart suspension technology provides consistent dampening that lets drivers maintain cruising speeds more effectively, cutting down on the brake-and-accelerate cycles that waste fuel.
For individual vehicle owners, fuel efficiency improvements typically range from 8% to 12%—that’s $800 to $1,200 in annual savings per vehicle. Over five years, you’re looking at $4,000 to $6,000 in fuel cost savings that directly offset the initial investment premium.
Tire Life Extension: Hidden Savings Add Up
The Honolulu case study documented something interesting: front tire replacement rates are nearly 2:1 better on LiquidSpring®-equipped vehicles. This happens because LiquidSpring® maintains superior wheel alignment stability and reduces road shock transmission to the tire contact patch.
Traditional suspension systems typically get 50,000 to 60,000 miles from tires under normal conditions. LiquidSpring®-equipped vehicles consistently achieve 75,000 to 90,000 miles of tire life—that’s 25% to 50% longer. For commercial fleets, this translates to $1,500 to $2,500 in tire replacement savings per vehicle over five years.
The tire life extension delivers benefits beyond just cost savings. Extended replacement intervals mean less vehicle downtime, simpler inventory management, and fewer administrative headaches for fleet operators. Your vehicles stay on the road where they belong, not in the shop getting new tires.
Operational Benefits: The Value of Reliability
The cost savings are just one piece of the puzzle. LiquidSpring® delivers operational benefits that go beyond what you can easily measure. Honolulu completely eliminated passenger injuries related to sudden vehicle movements after installing LiquidSpring® systems. That’s not only a safety win—it directly reduces liability costs, workers’ compensation claims, and insurance premiums.
Then there’s the downtime factor. Traditional suspension systems need constant attention, pulling vehicles out of service for repairs. LiquidSpring’s sealed design means your vehicles stay on the road where they belong. Less downtime means you need fewer spare vehicles and get maximum use from your fleet.
Fleet managers consistently report saving $500 to $1,000 per vehicle annually just from reduced downtime. Add another $200 to $500 in lower liability costs, and you’re looking at $3,500 to $7,500 in additional value per vehicle over five years. These aren’t theoretical benefits—they’re real savings that show up in your budget.
Five-Year Financial Comparison
| Cost Category | Traditional Suspension | LiquidSpring® | Savings |
| Initial Investment | $8,000 | $28,000 | ($20,000) |
| Maintenance (100,000 miles) | $12,400 | $8,300 | $4,100 |
| Fuel Costs | $25,000 | $22,000 | $3,000 |
| Tire Replacement | $4,000 | $2,500 | $1,500 |
| Total Five-Year Cost | $49,400 | $60,800 | ($11,400) |
Break-Even Analysis and Long-Term Value
LiquidSpring® reaches its break-even point at approximately 5.8 years for typical fleet applications. Yes, the upfront investment is significant, but the operational savings accelerate after break-even, delivering substantial value for the life of the vehicle.
That $11,400 premium over five years might seem substantial, but it represents quality engineering that pays dividends long-term. When you factor in the safety improvements, reduced downtime, and enhanced performance that LiquidSpring® delivers, the investment makes sense for fleet operators planning beyond the typical replacement cycle.
What This Means for Different Types of Users
Fleet vs. Individual Owner Reality Check
The Honolulu fleet numbers are impressive, but if you’re driving your RV 10,000 miles a year or your adventure truck 15,000 miles annually, your savings timeline will look different.
For High-Mileage Users (Fleet/Commercial/Full-Time RVers):
- Break-even around 5-6 years
- Substantial annual savings after break-even
- Maintenance and fuel savings add up quickly
- The investment math works clearly in your favor
For Typical Personal Use (10,000-15,000 miles annually):
- Break-even extends to 8-10 years
- Annual savings are more modest
- You’re investing primarily in comfort, safety, and ride quality
- The financial case is less dramatic, but the experience improvement is substantial
Why LiquidSpring® Still Makes Sense for Lower-Mileage Users:
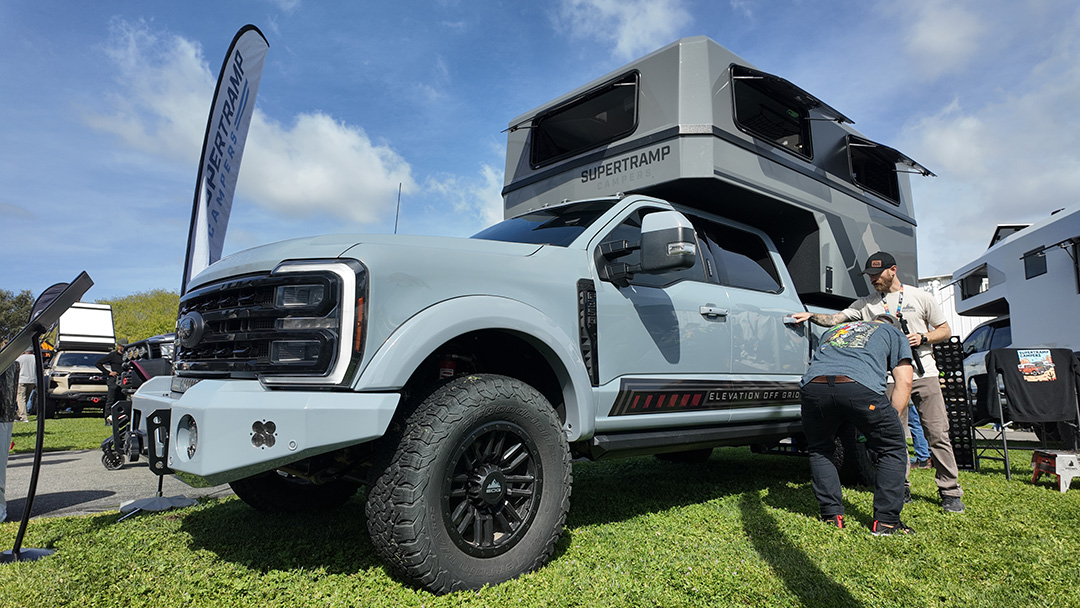
The comfort difference is immediate and dramatic. Ask any RV owner who’s installed LiquidSpring®—the improved ride quality, reduced fatigue, and enhanced safety aren’t measured in dollars saved, but in enjoyment gained. You’re buying a suspension that promises confidence on mountain roads, comfort during long days behind the wheel, and the peace of mind that comes with superior handling.
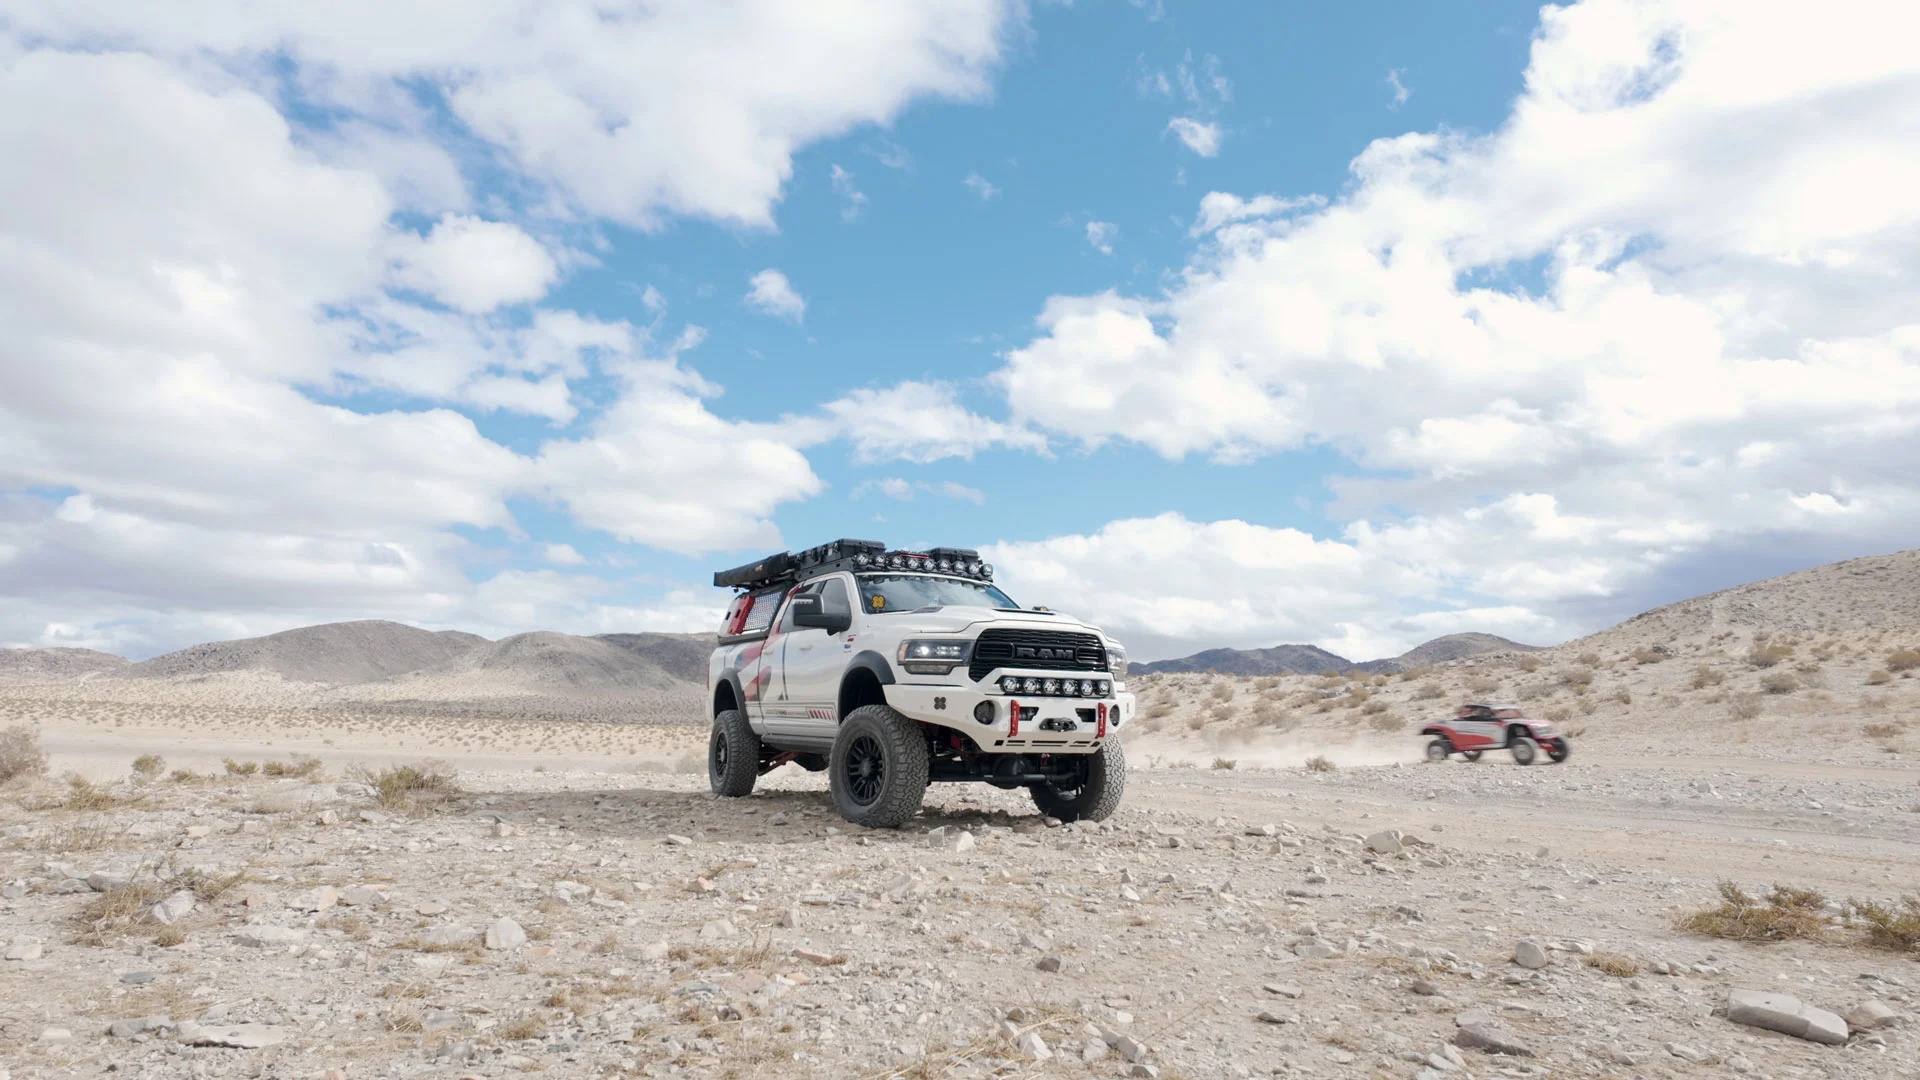
For adventure truck owners exploring remote areas, the reliability and consistent performance matter more than the break-even calculation. When you’re 200 miles from the nearest service station, having suspension that works flawlessly in any condition is essential.
The Bottom Line: High-mileage users see clear financial benefits relatively quickly. Personal-use owners invest primarily in dramatically improved ride quality and long-term durability, with modest financial benefits over the long haul. Both get proven technology that improves their driving experience.
Why LiquidSpring® Beats All Traditional Options
Technology Advantages
Active vs. Passive Systems: LiquidSpring® represents the only truly active suspension system in the commercial market. While traditional systems react to road conditions, LiquidSpring® anticipates and adjusts proactively.
Reliability Through Simplicity: The liquid-based strut design eliminates the complex air systems, multiple bushings, and failure-prone components typically found in traditional suspensions. This translates to fewer maintenance events and lower long-term costs.
Performance Without Compromise: Traditional suspension systems force compromises between comfort and handling. LiquidSpring® delivers both through its variable spring rate technology.
Real-World Validation
Honolulu Case Study Results: The Honolulu paratransit fleet study demonstrates:
- 33% maintenance cost reduction confirmed across 164 vehicles
- Complete elimination of passenger injuries
- Significant fuel efficiency improvements
- Extended tire life and reduced component wear
Industry Recognition:
- 97% of Type 1 ambulances choose LiquidSpring® when lives are on the line
- 30,000+ vehicles equipped with LiquidSpring® technology
- Proven track record across emergency services, transit, and commercial applications

Total Cost of Ownership Conclusion
The suspension system total cost of ownership analysis reveals that LiquidSpring® delivers superior value through:
- Reduced maintenance costs
- Improved fuel efficiency
- Extended component life
- Enhanced safety
- Operational efficiency
Financial Bottom Line:
- Initial investment premium: $16,000-$23,000
- Five-year break-even: Month 70 for typical applications
- Beyond year 6: $2,000-$3,000 annual savings begin
- Years 7-10: $2,000-$3,000 annual savings continue
Making the Investment Decision
Bobby Wallace from Honolulu Paratransit Services puts it perfectly: “Initial investment always seems so much more expensive, but it’s one of those things where once you have it, you don’t want to let it go.”
The data backs up what customers experience every day. LiquidSpring® delivers measurable financial benefits while giving you performance, safety, and reliability that traditional suspension simply can’t match.
Whether you’re managing a fleet, living full-time in your RV, or pushing your adventure truck to its limits, the total cost of ownership analysis shows that LiquidSpring® is the smart financial choice when you’re thinking long-term.
Contact our team for a consultation tailored to your specific application and requirements.